//
//scat plot command
//
//this plot command draws various graph according to number of variables.
//According to number of variables,graph type is bellow
//1 -> histgram
//2 -> 2 dimension scat plot
//3 -> 3 dimension scat plot
//over 4 -> matrix of scat plot
//Syntax without category variable.
plot scat [variables];
//Syntax with category variable.
plot scat [variables] by [category variable];
//Option
line=xx //xx is yes/on/ON/1 -> link points with lines
title=title //tilte strings
xlabel=x //x axis strings
ylabel=y //y axis strings
zlabel=z //z axis strings
xrange=[xmin:xmax]
yrange=[ymin:ymax]
zrange=[zmin:zmax]
xpitch=xp //xtics pitch span
ypitch=yp //ytics pitch span
xrotate=90 //vertical x tics
marker: type //example:o,+,x,A,V,box,OF,BF,AF,VF,DF,PF
color:color //example:black,red,blue,green,yellow
marksize:nn //marker size
width:nn //line size
regcolor:color //regression line color
labels //view points with labels
//Caution
//In this plot command,number of variable is less then 7.
//When draws matrix of scat plot,ignore category variable.
//If you specify cathgory using [by], option of marker type and color is ignored.
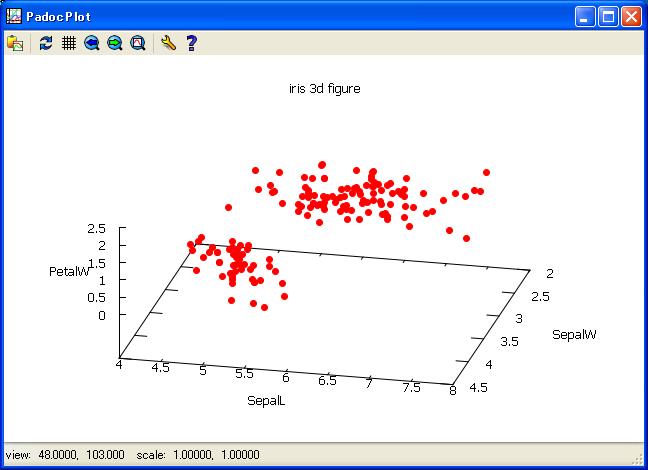
//Example read Iris data
get irisR.csv@;
//Example 1 seting options for title and red marker type
plot scat SepalW SepalL PetalW/
marker=OF
color=red
title=iris 3d figure
;
//Example 2 draw Figure according to number of variable
get irisR.csv@;
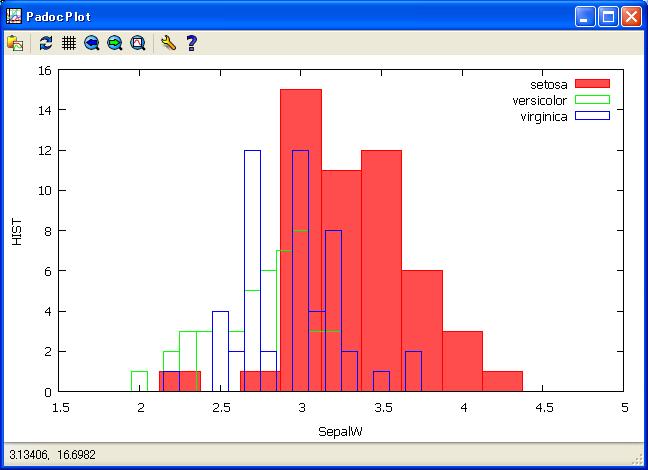
//Because of 1 variable,draw histgram.
plot scat SepalW by Species;
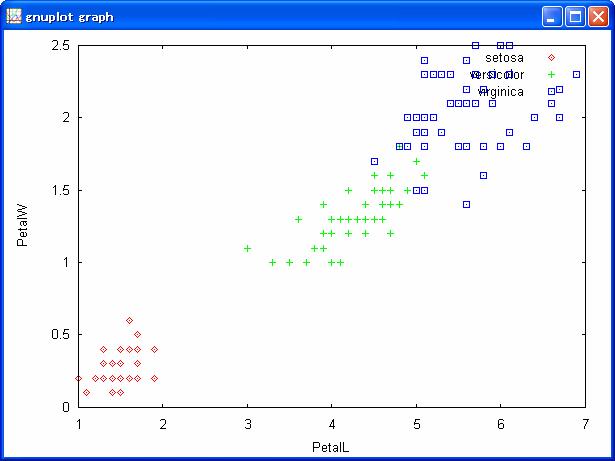
//Because of 2 variables,draw scat plot in 2 dimension.
plot scat SepalW SepalL by Species;
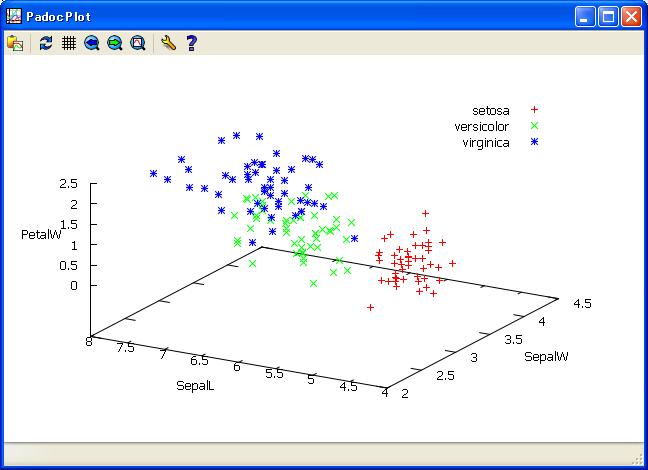
//Because of 3 variables,draw scat plot in 3 dimension.
plot scat SepalW SepalL PetalW by Species;
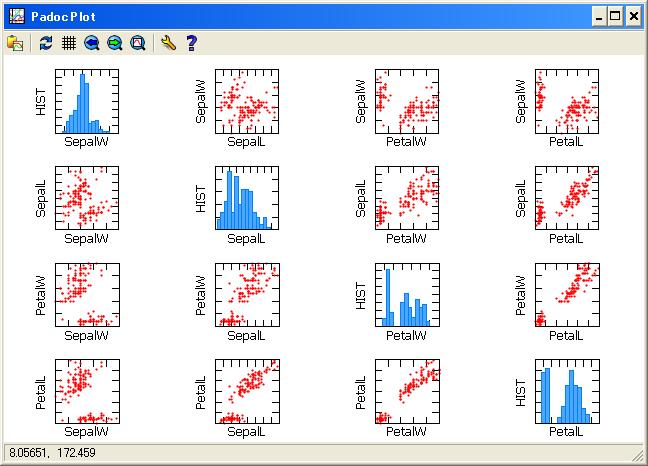
//Because of 4 variables,draw matrix of scat plot.
plot scat SepalW SepalL PetalW PetalL/
marker=OF
marksize=0.2
mxcolor=blue
;
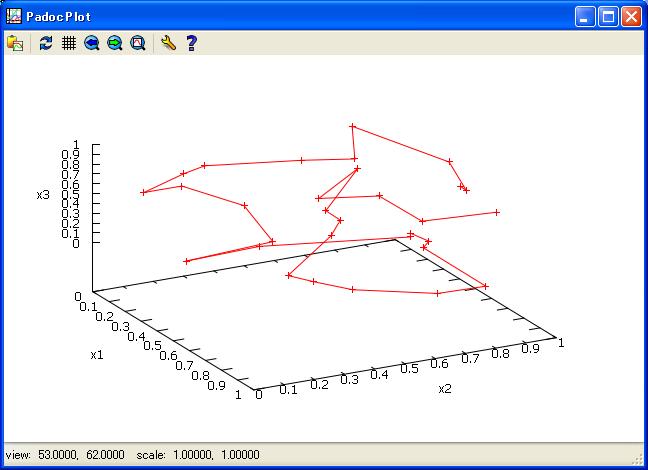
//Example 3 link points with lines by line option.
clear;
for(i=0;i<=30;i++) {
x1=random;
x2=random;
x3=random;
outrec;
}
anneal x1 x2 x3;
put ana1;
get ana1;
plot scat x1 x2 x3/
line=yes
;
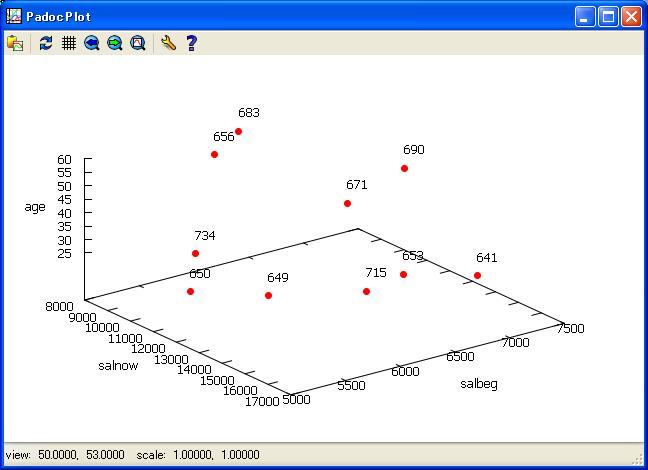
//Example 4 view labels defined 'by' following variables using option 'labels=yes'
get bankR.csv@;
if(#<= 10) outrec;
attr name type/
id code
;
plot scan salnow salbeg by id/
labels=yes
marker=OF
color=red
;
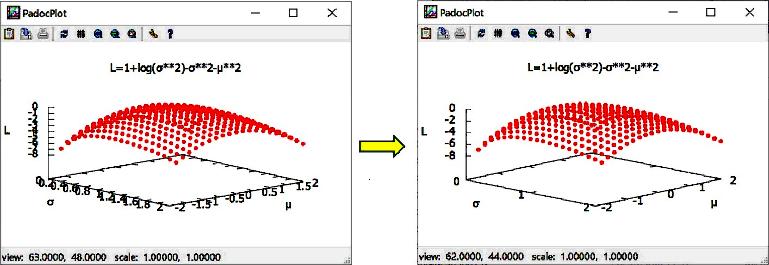
//Example 5 pitch changing for better 3D view
/* generate Encoder part of VAE
clear;
for(i=1;i<=20;i++) {
s=i*0.1;
for(j=1;j<=20;j++) {
u=j*0.2-2;
L=1+log(s**2)-s**2-u**2;
outrec;
}
}
put encoder;
get encoder;
/* changing 3 axis pitch for better 3D view */
plot scat s u L/
zlabel=L
xlabel=ƒÐ
ylabel=ƒÊ
title=L=1+log(ƒÐ**2)-ƒÐ**2-ƒÊ**2
marker=OF
color=red
ypitch=1
xpitch=1
zpitch=2
;