//
//Draw regressin line or squrare with data
//
//this plot command draws regression line or square.
//Syntax
plot reg;
//Option
title=title //tilte strings
xlabel=x //x axis strings
ylabel=y //y axis strings
zlabel=z //z axis strings
xrange=[xmin:xmax]
yrange=[ymin:ymax]
zrange=[zmin:zmax]
marker:type //example:o,+,x,A,V,box,OF,BF,AF,VF,DF,PF
color:color //example:black,red,blue,green,yellow
marksize:nn //marker size
width:nn //line size
regcolor:color //regression line color
xrotate=90 //vertical x tics
//Cation
//Befor this plot command,you have to read outputs of regression.
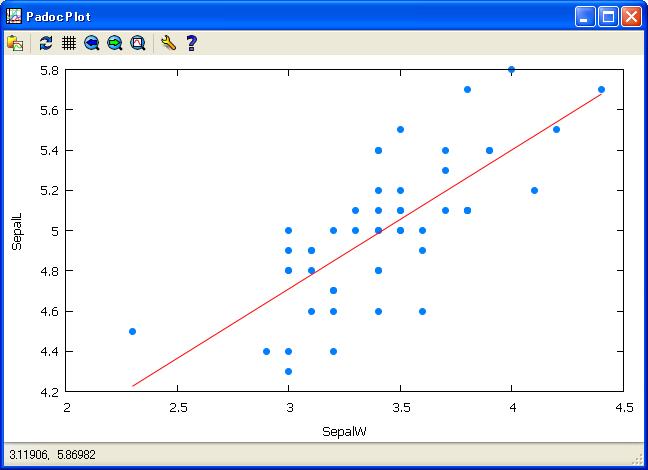
//if 2 dimension regression ex. y=a*x+b,plot reg draws line.
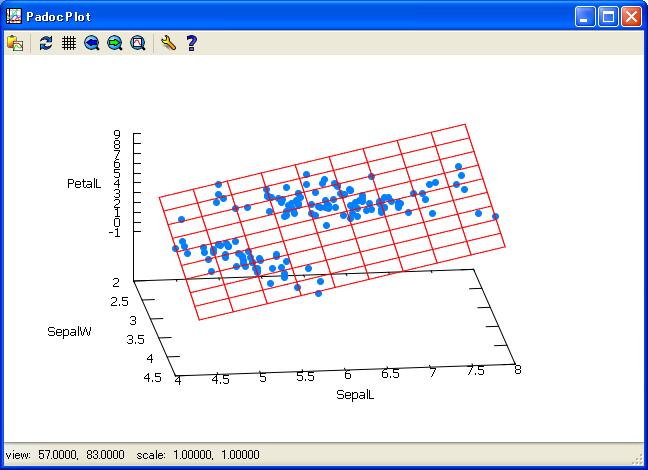
//if 3 dimension regression ex. z=a*x+b*y+c,plot reg draws square.
//Example is 3 dimension regresion square.
get iris@.csv;
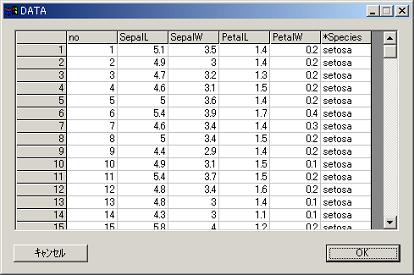
//regression only setosa.
if(Species == "setosa") outrec;
reg SepalL by SepalW;
//get regression coefficent from outputs.
get freq@ana;
plot reg/
marker=OF
color=blue
regcolor=red
;
//regression in 3 dimension.
reg PetalL by SepalW SepalL;
//get regression coefficent from outputs.
get freq@ana;
//draws regression square.
plot reg/
marker=OF
color=blue
regcolor=red
;