//
//Histgram command
//
//This command draws histgram.
//
//Remark:There are three display in the histgram
//1. Histgram of one variable
//2. Histgram of multiple variables
//3. Histgram by category
//
//1.Syntax one valwithout category variable.
plot hist [variable];
//2. Systax multiple variables
plot hist [variable1 variable2 ...]
//3.Syntax with category variable.
hist [variable] by [category variable];
//Option
title=title //title strings
xlabel=x //x axis strings
ylabel=y //y axis strings
zlabel=z //z axis strings
xpitch=xp //xtics pitch span
ypitch=yp //ytics pitch span
xrotate=90 //vertical x tics
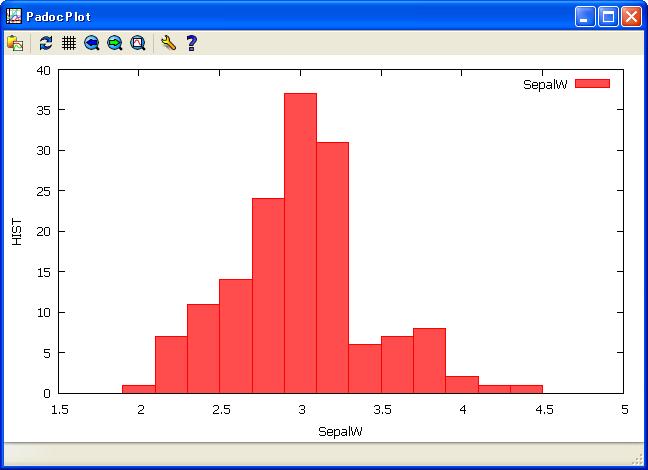
//Exampe l 1 Single histgram
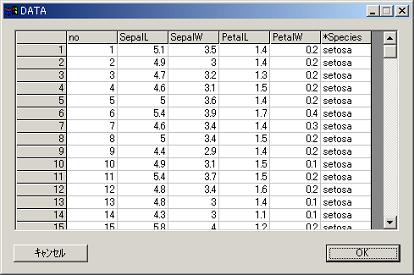
get irisR.csv@;
plot hist SepalW;
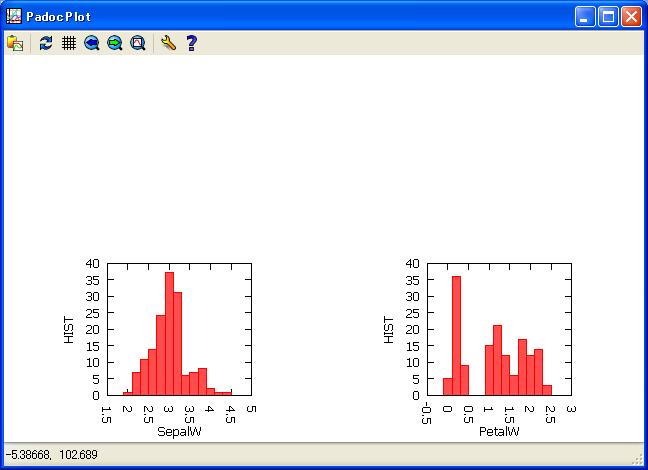
//Example 2-1 two histgram with vertical xtics
plot hist SepalW PetalW/
xrotate=90
;
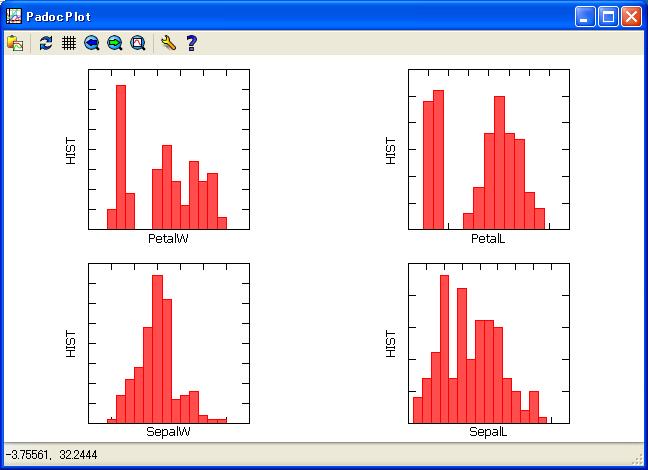
//Example 2-2 Multiple histgram without x tics
//If num of variables are 3 or more, histram draws without x tics.
plot hist SepalW SepalL PetalW PetalL;
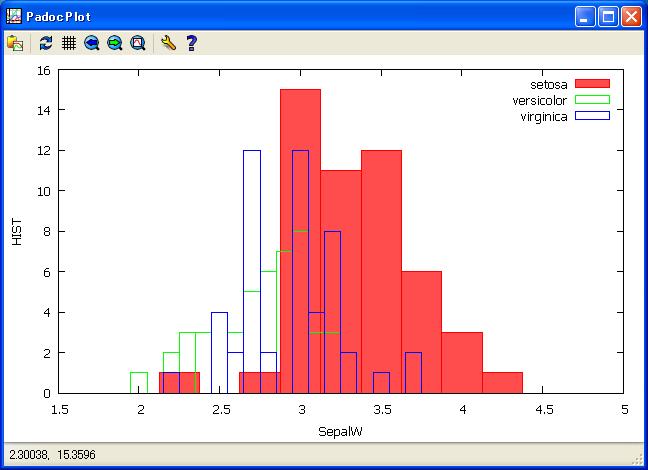
//Example 3 Histgram by category
plot hist SepalW by Species;