//
//Box mustache plot command
//
//this plot command draws Box mustache graph.
//syntax when x axis variable is defined.
plot box [variable] by [variable]
//Syntax when x axis is record number.
plot box [variable];
//Remarks meaning of each point is bellow.
//
// Å@ Å¢ maxmum
//
// | 95%tail
// |
// +--+--+ 75%tail
// | |
// | |
// | |
// | |
// | * | middle
// | |
// +--+--+ 25%tail
// |
// | 5%tail
//
// ŧ minimum
//Option
title=title //title strings
xlabel=x //x axis strings
ylabel=y //y axis strings
zlabel=z //z axis strings
xrange=[xmin:xmax]
yrange=[ymin:ymax]
zrange=[zmin:zmax]
xrotate=90 //virtical x tics
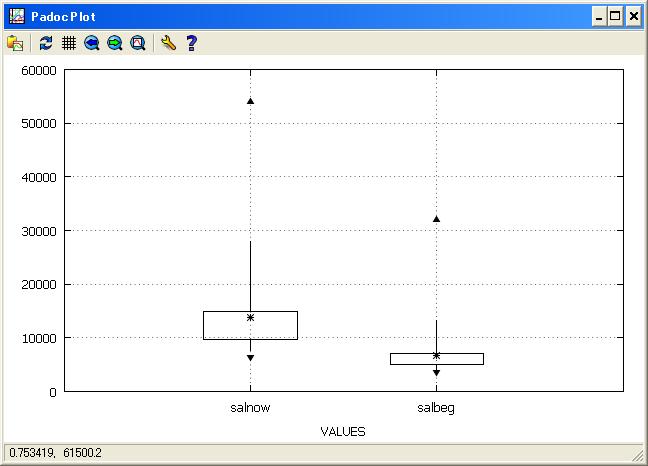
//Example is ploting candle for two values
get bank.csv@;
plot box salnow salbeg;
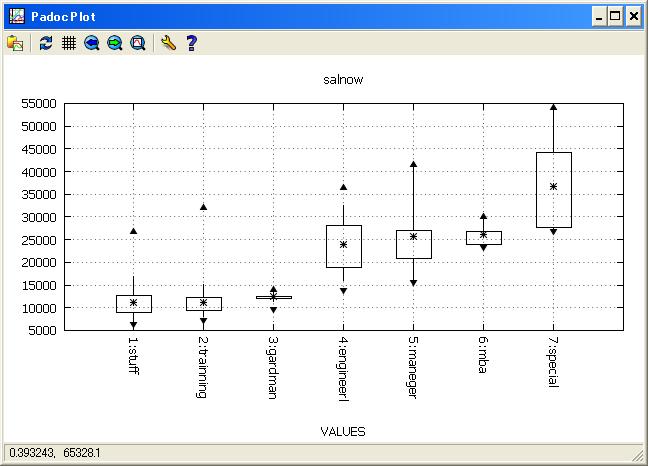
//Example is ploting candle figure about salary amount by each jobname
get bank.csv@;
hand jobcat jobname/
1 1:stuff
2 2:trainning
3 3:gardman
4 4:engineerl
5 5:maneger
6 6:mba
7 7:special
;
put jobcat_;
//read banker data
get bank.csv@;
merge jobcat_ by jobcat;
//plot candle about figure salary amount by each jobname with x vertical tics.
plot box salnow by jobname/
xrotate=90
;