//
//line plot command
//
//this plot command draws line graph.
//syntax when x axis variable is defined.
plot line [variable] by [variable]
//Syntax when x axis is record number.
plot line [variable];
//Option
//title=title strings
//xlabel=x axis strings
//ylabel=y axis strings
//zlabel=z axis strings
//xrange=[xmin:xmax]
//yrange=[ymin:ymax]
//zrange=[zmin:zmax]
//xpitch=xp xtics pitch span
//ypitch=yp ytics pitch span
//marker:marker type example:o,+,x,A,V,box,OF,BF,AF,VF,DF,PF
//color:color example:black,red,blue,green,yellow
//marksize:marker size
//width:line size
//regcolor:regression line color
//xrotate=90 //vertical x tics
//Catution
//if marker option is existed, this plot line is replaced by markers.
//if x tics is categoral,then xpitch is num of span,else xpitch is xtics value.
//Example is inspection of decsion tree precison.
get dmKNJa@;
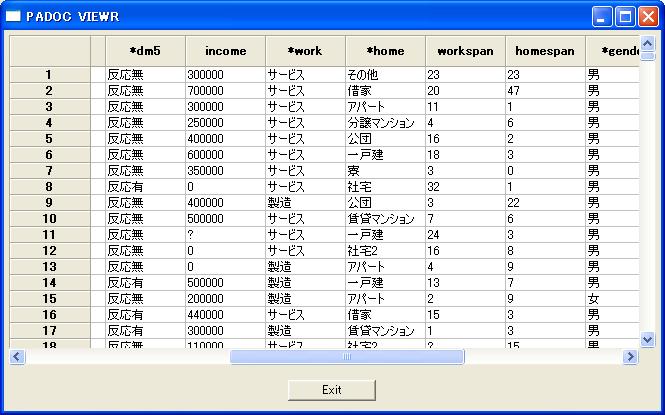
attr; //view all variables inoder to cut variables from result window.
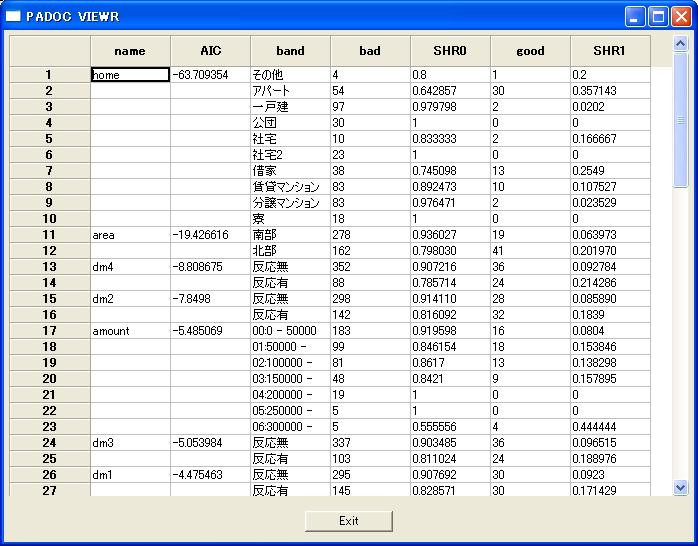
aic react by
age //number
area //tchar/code
dm1 //tchar/code
dm2 //tchar/code
dm3 //tchar/code
dm4 //tchar/code
dm5 //tchar/code
income //number
work //tchar/code
home //tchar/code
workspan //number
homespan //number
sex //tchar/code
family //number
job //tchar/code
amount //number
;
tree react by
age //number
area //tchar/code
dm1 //tchar/code
dm2 //tchar/code
dm3 //tchar/code
dm4 //tchar/code
dm5 //tchar/code
income //number
work //tchar/code
home //tchar/code
workspan //number
homespan //number
sex //tchar/code
family //number
job //tchar/code
amount /
target/good,bad
terminal=10
;
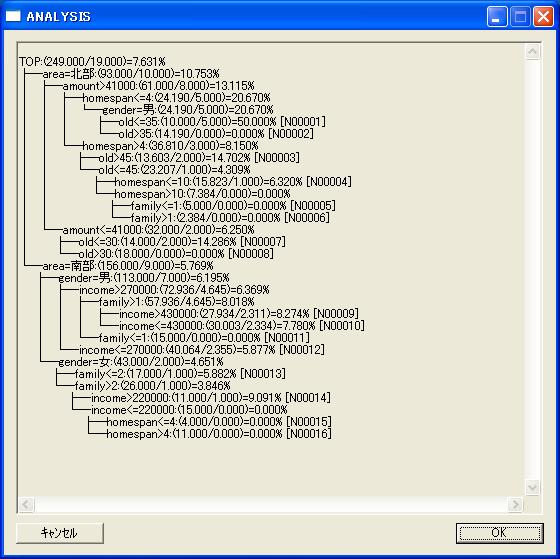
//get score from output of decsion tree.
get freq@ana;
//make graph for precision of decsion tree.
plot line distincRate distincRatio by countRate;
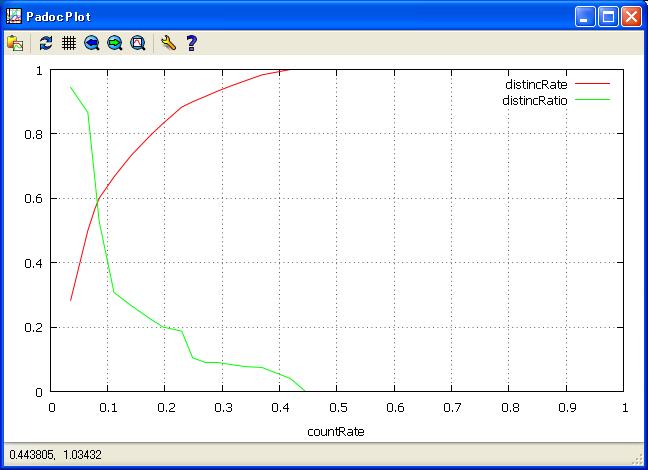
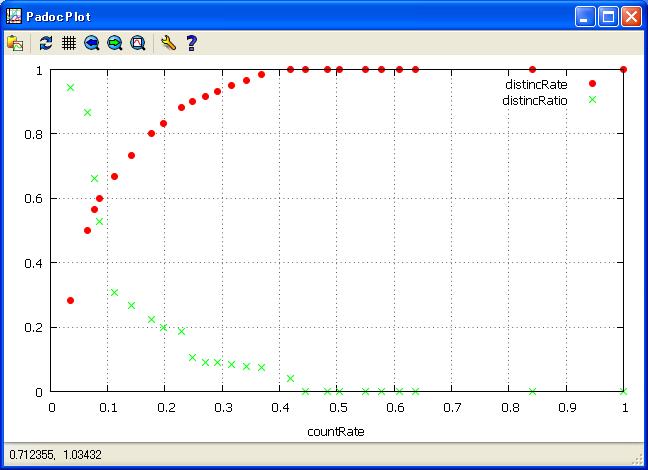
//If you set marker option in plot line command, you have marker curve.
plot line distincRate distincRatio by countRate/
marker=OF
color=red
;
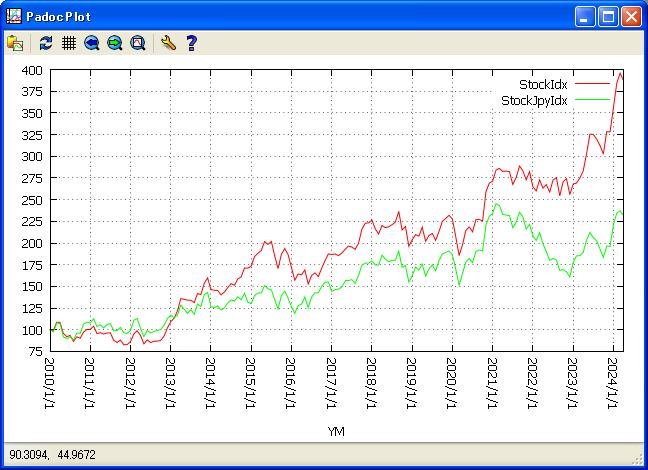
//Examble plot year and month time series to years series by changing xtics pitch
get nikkei_jp.csv@/
titleline=1
;
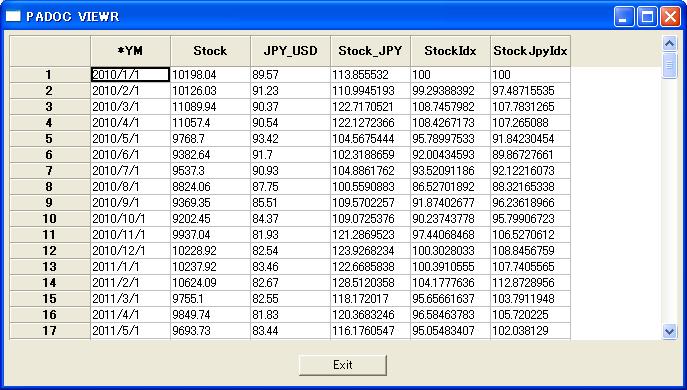
plot line StockIdx StockJpyIdx by YM/
xpitch=12
xrotate=90
ypitch=25
;