//
//Bar plot command
//
//this plot command draws bar graph.
//syntax when x axis variable is defined.
plot bar [variable] by [variable]
//Syntax when x axis is record number.
plot bar [variables];
//Option
//title=title strings
//xlabel=x axis strings
//ylabel=y axis strings
//zlabel=z axis strings
//xrange=[xmin:xmax]
//yrange=[ymin:ymax]
//zrange=[zmin:zmax]
//color:color example:black,red,blue,green,yellow
//xrotate=90 //vertical x tics
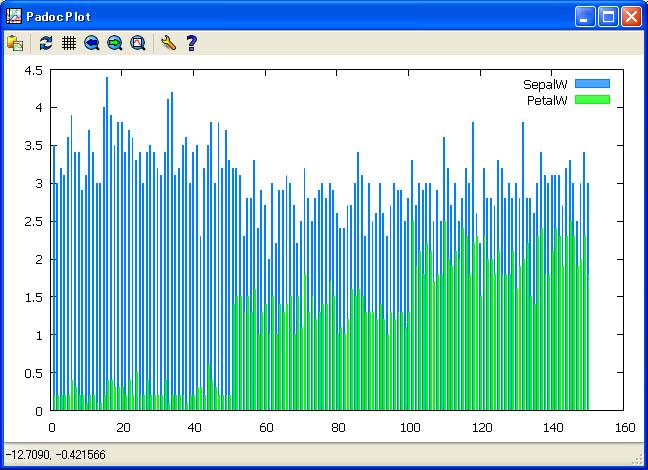
//Example
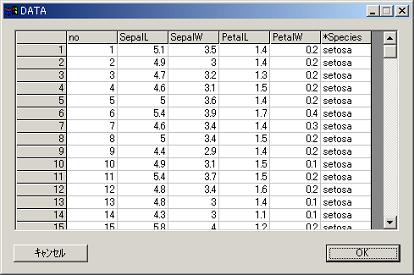
get iris.csv@;
plot SepalW PetalW/
color=blue
;
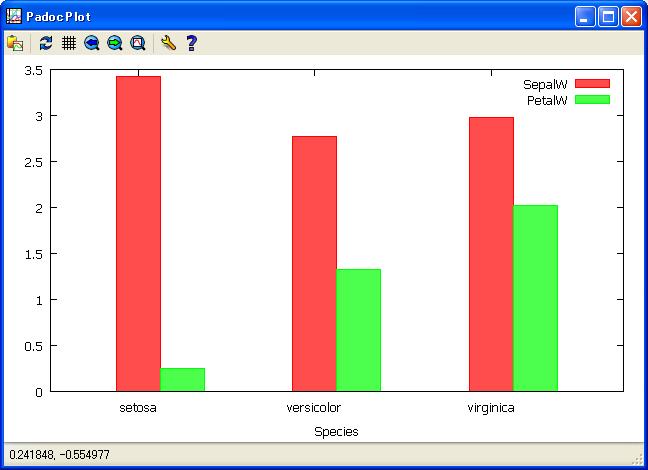
//summary by Species
sumup SepalW PetalW by Species/
method=average
;
anaput result;
get result;
plot bar SepalW PetalW by Species;